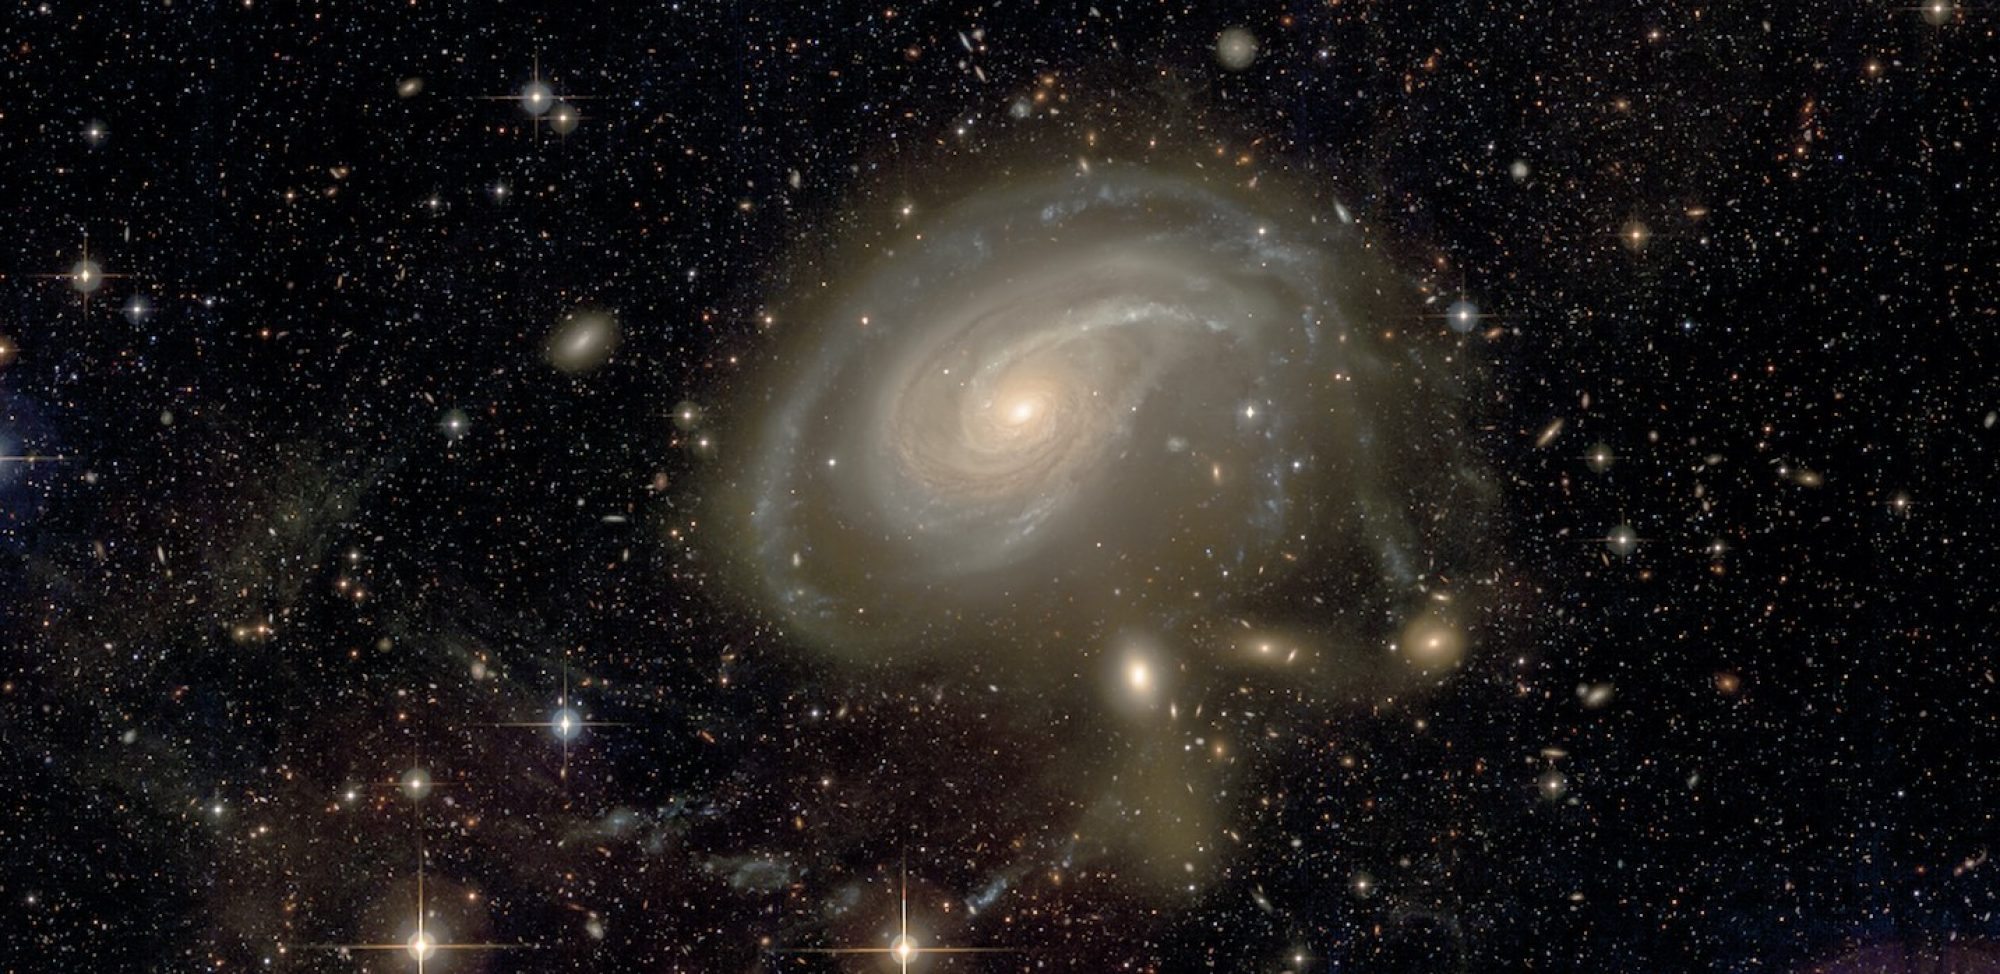
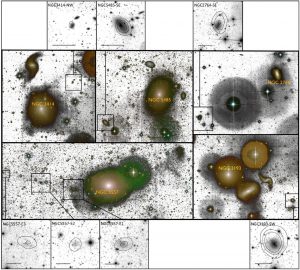
Central panels: composite g′ + r′ or g′ + r′ + i′ MegaCam images of the ETGs hosting the dwarf galaxies studied here. The faintest low surface brightness features are shown as inverted grey maps for better contrast. The ETG satellites for which a spectroscopic follow-up was carried out are indicated with the squares. Top and bottom panels: MegaCam g′-band surface brightness maps of the pre-selected satellites. The field of view of each panel is 3 × 3 arcmin. Each bar corresponds to a physical length of 10 kpc. Grey-scale levels range between 22 and 28.5 mag arcsec−2. H I contours from the WSRT observations are superimposed. Levels correspond to 0.7, 1.4 and 2.1 × 1020 cm−2.
(Duc et al., 2014)


